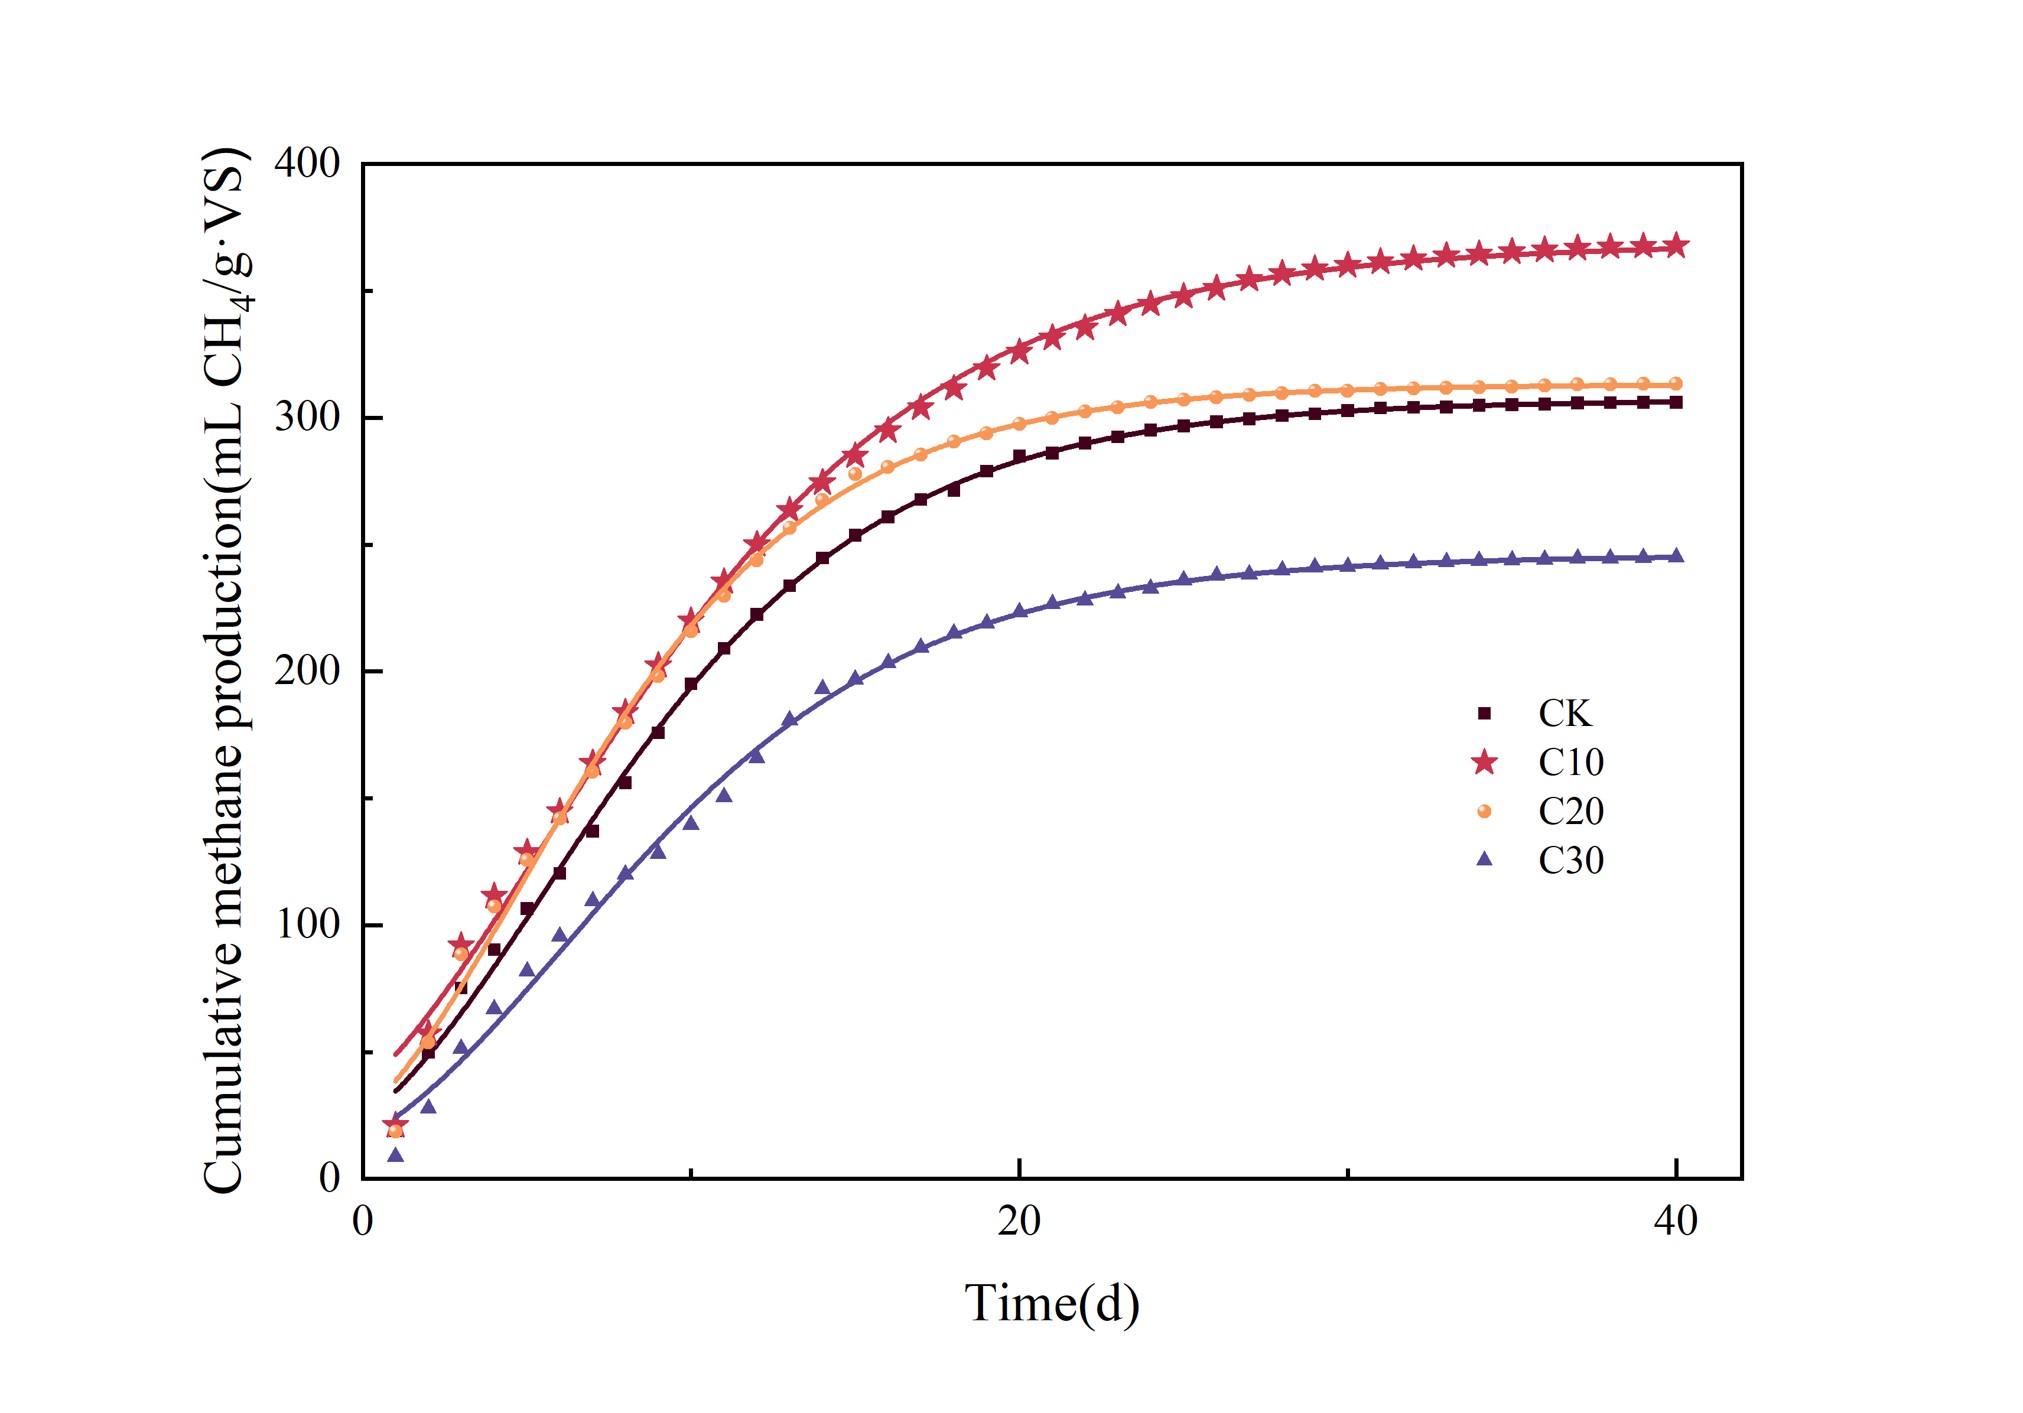
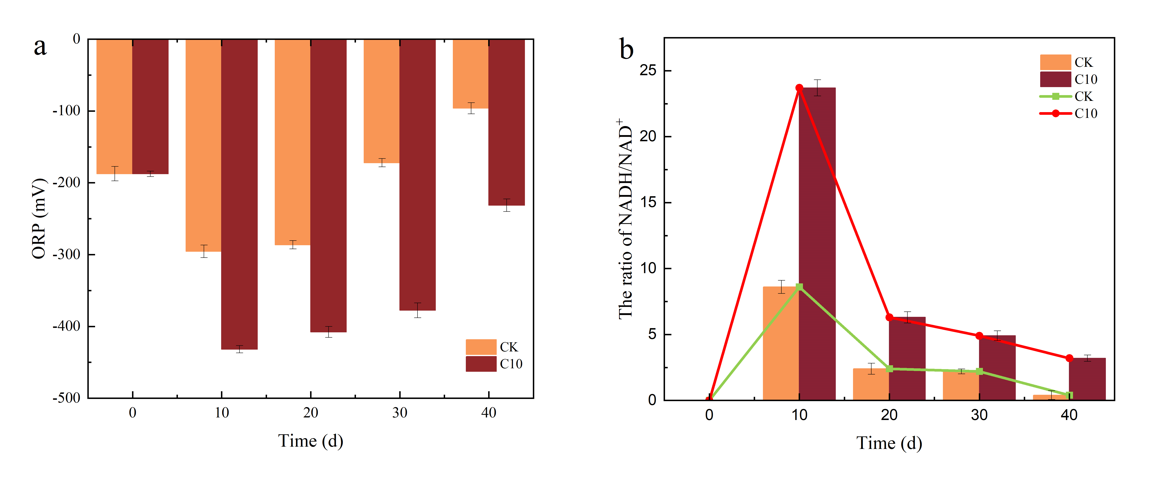
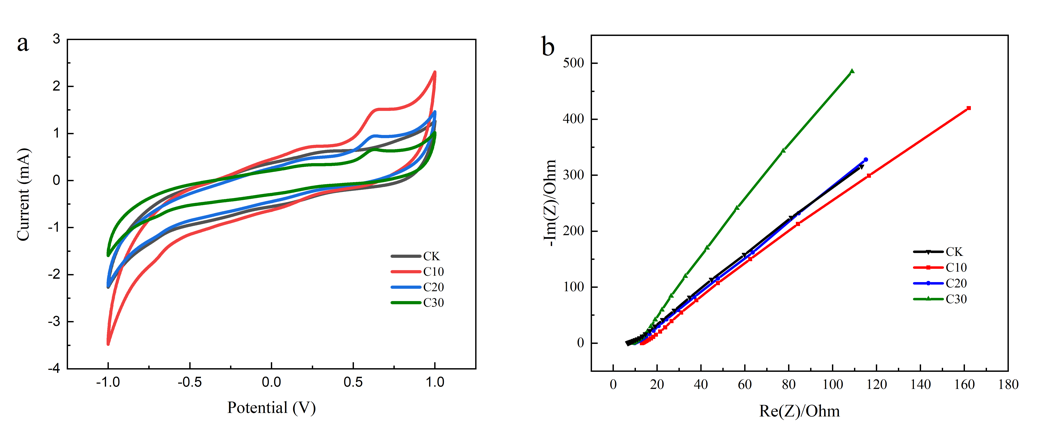
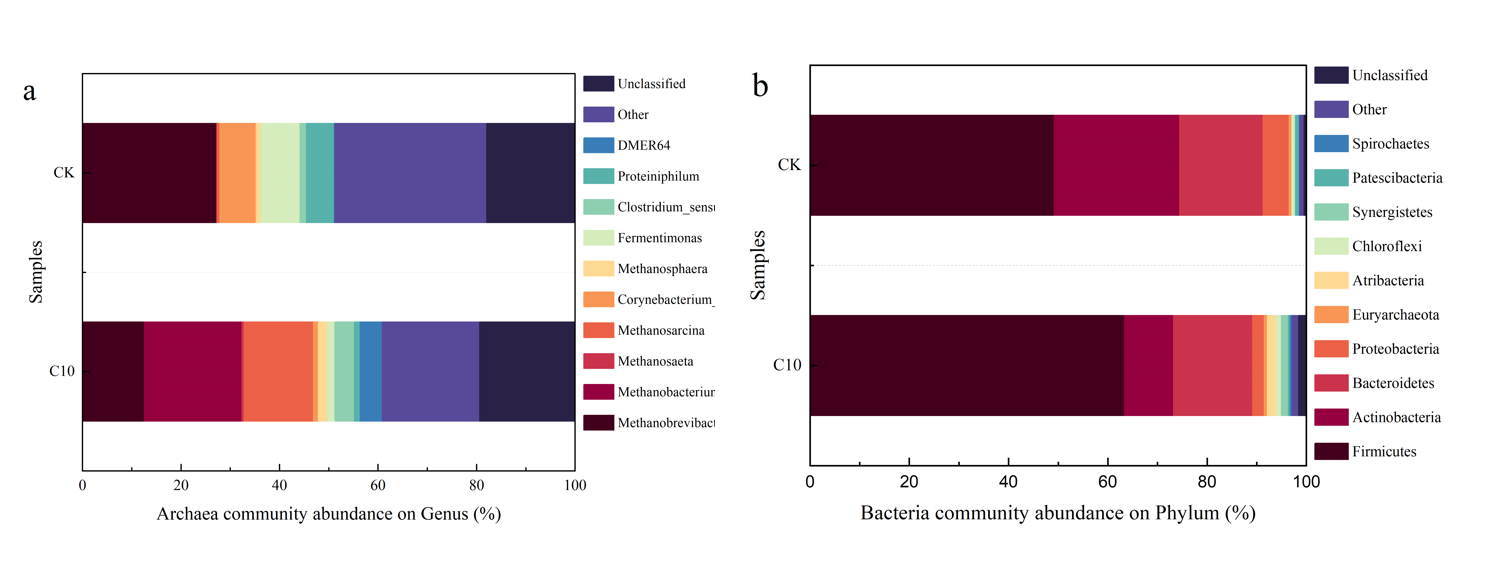
As a large agricultural country, China produces a large amount of wheat straw each year that needs to be treated harmlessly. Anaerobic digestion (AD) has a great potential to produce clean energy biogas while treating wheat straw. AD as a typical fermentation process, the regeneration of NAD+ is achieved by fermentation using NADH to reduce metabolic intermediates and therefore there is a lack of reduction capacity in the metabolic process. The low reducing power of the digestion system and the low methane yield of wheat straw in the AD process have limited the further development of this technology. Cerium dioxide nanoparticles (CDNs) are known for their excellent reducing powers. At the same time the large amount of cerium contained in the earth provides the conditions for its large-scale use. In this study, we evaluated the effects of CDNs on the AD of wheat straw. The CDNs were successfully prepared via hydrothermal synthesis. The particle size of CDNs was about 5 nm, the measured specific surface area was 168.02 m2/g, and the zeta potential was 10.70 mV. Experiments involving volatile fatty acids (VFAs), cyclic voltammetry curves, electrochemical impedance spectroscopy, oxidation-reduction potential, and NADH/NAD+ showed that CDNs effectively enhanced the reducing power and utilization of VFAs. Additionally, the cumulative methane production of the C10 group was 20.15% higher than CK group, reaching 367.78 mL CH4/g·VS. The cumulative methane production was well fitted using the modified Gompertz equation (R2 = 0.99677). Analysis of microbial community structure showed that CDNs increased bacterial abundance in hydrolytic acidification. The reduction ability of CDNs is very important for the improvement of the methane production efficiency of AD, which is of great interest for the study of nanoparticles that promote AD.

Fig. 1. The modified Gompertz fitting curve of cumulative methane production in all experiment groups after adding different concentration CDNs.

Fig. 2. The change of oxidation-reduction potential (a) and ratio of NADH/NAH+ (b) at different in different groups. All data were the averages from three parallel experiments.

Fig. 3. Cyclic voltammetry characteristic curve (a) and electrochemical impedance spectroscopy (b) of all experimental groups with different concentration CDNs at the end of AD.

Fig. 4. Relative abundance of archaea at genus level (a) and bacteria at phylum level (b) of CK and C10 groups at the end of AD.
Read more: https://doi.org/10.1016/j.jclepro.2022.134231


